
Production Data Without Context Creates Blind Spots
Many manufacturers collect large amounts of data but struggle to transform it into meaningful insights. OSPHIM provides transparency across machines, tools, and production lines.
Data spread across multiple systems
Limited visibility into production performance
Hidden inefficiencies and process deviations
Slow identification of optimization opportunities
One Platform for Production Transparency
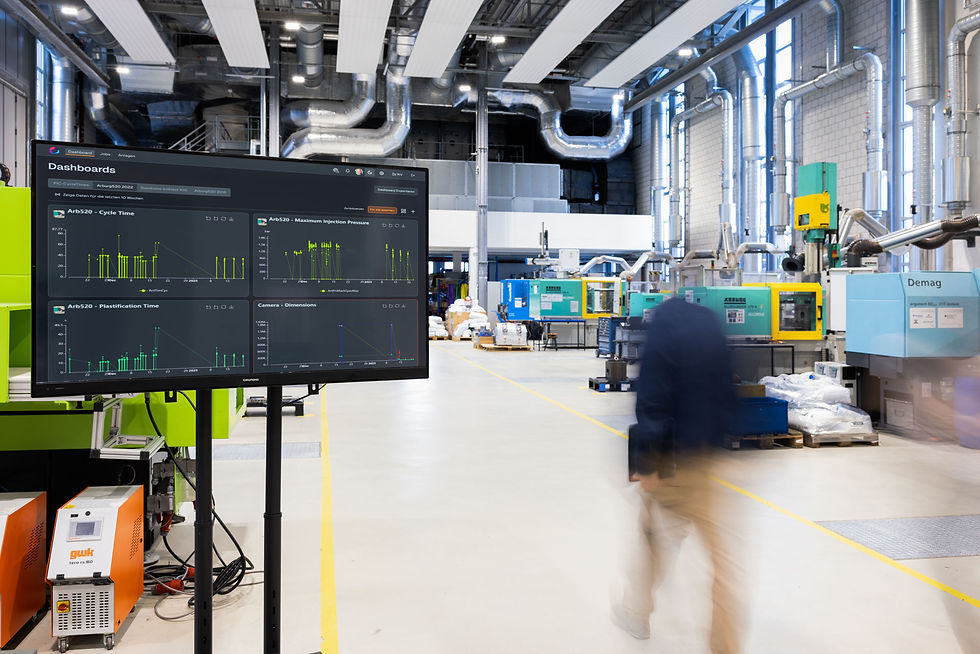
Production Dashboards
Monitor production, quality, and process KPIs in real time.
Digital Shopfloor
Visualize your production hall and machine park.

Comparative Analytics
Compare processes, machines, and tools to see improvement opportunities.
.png)
01
PRODUCTION DASHBOARDS
Dashboards Tailored to Your Needs
Create process- or role-specific dashboards for operators, engineers, production managers, and executives.
Features
Combine your visualization needs
Fully control your views
Share your dashboards with others
Use process-specific widgets
Custom KPI visualization
02
DIGITAL SHOPFLOOR
See Your Production at a Glance
Visualize machines, peripherals, and production cells on a configurable 2D shopfloor layout.


03
COMPARATIVE ANALYTICS
Understand Why Processes Perform Differently
Compare machines, tools, materials, shifts, or production sites to uncover hidden differences and optimization potential.

Features
Find inefficiencies, e.g. in sister molds
Compare machine performance
Analyze shift performances across timeranges
Leverage knowledge to optimize production sites

BUSINESS IMPACT
Turn Insights into Better Decisions
Transform production data into measurable improvements by identifying best-performing processes, reducing troubleshooting effort, and improving operational efficiency.
Faster troubleshooting
Improved process standardization
Increased machine utilization
Supdecision-making across teams